

What if the days you feel wiped out weren’t just “part of getting older”?
Perimenopause fatigue often looks like midday crashes, wired nights, and fuzzy thinking.
A simple symptom tracker—daily energy scores, sleep notes, and quick diet or stress flags—lets you spot the real patterns behind those bad days.
Tracking isn’t busywork: one trial found symptom tracking cut physical symptoms by 42% in two weeks versus 12% for the control group.
This post shows how to build a tracker you’ll actually use, find triggers fast, and take one small step that makes a real difference.
Practical Tools to Start a Perimenopause Fatigue Symptom Tracker
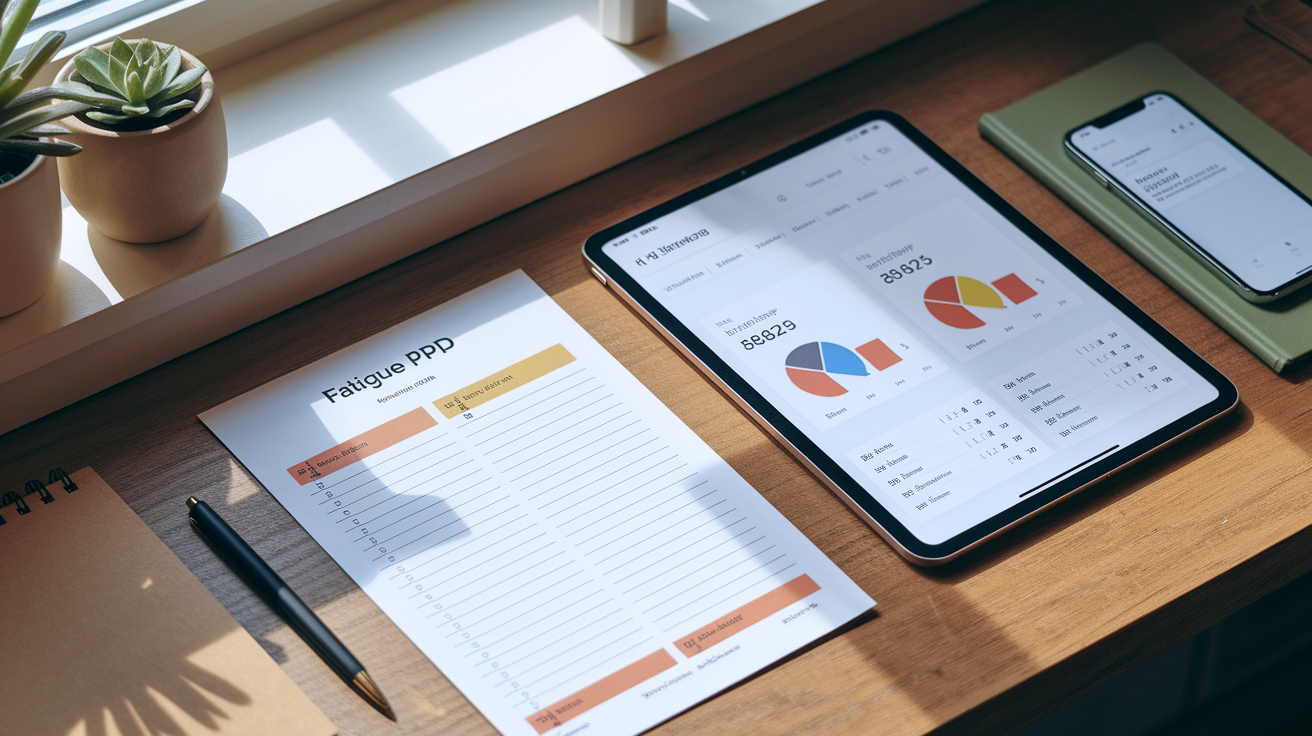
A perimenopause fatigue symptom tracker logs your daily energy levels, sleep patterns, and possible triggers. You’re looking for what’s draining you. The goal is to connect what you’re eating, how you’re sleeping, and how exhausted you feel each day.
You can start with a printable PDF worksheet, a Google Sheets template that auto-generates charts, or a symptom tracker app that sends reminders and creates reports you can share with your doctor. A randomized trial of 100 women in perimenopause and postmenopause found that tracking symptoms led to a 42% reduction in physical symptoms after just 2 weeks. The control group? 12% reduction. That’s a real return for a small daily habit.
Most trackers include the same core fields. The goal is capturing enough detail to reveal patterns without turning it into homework. Here’s what a good tracker includes:
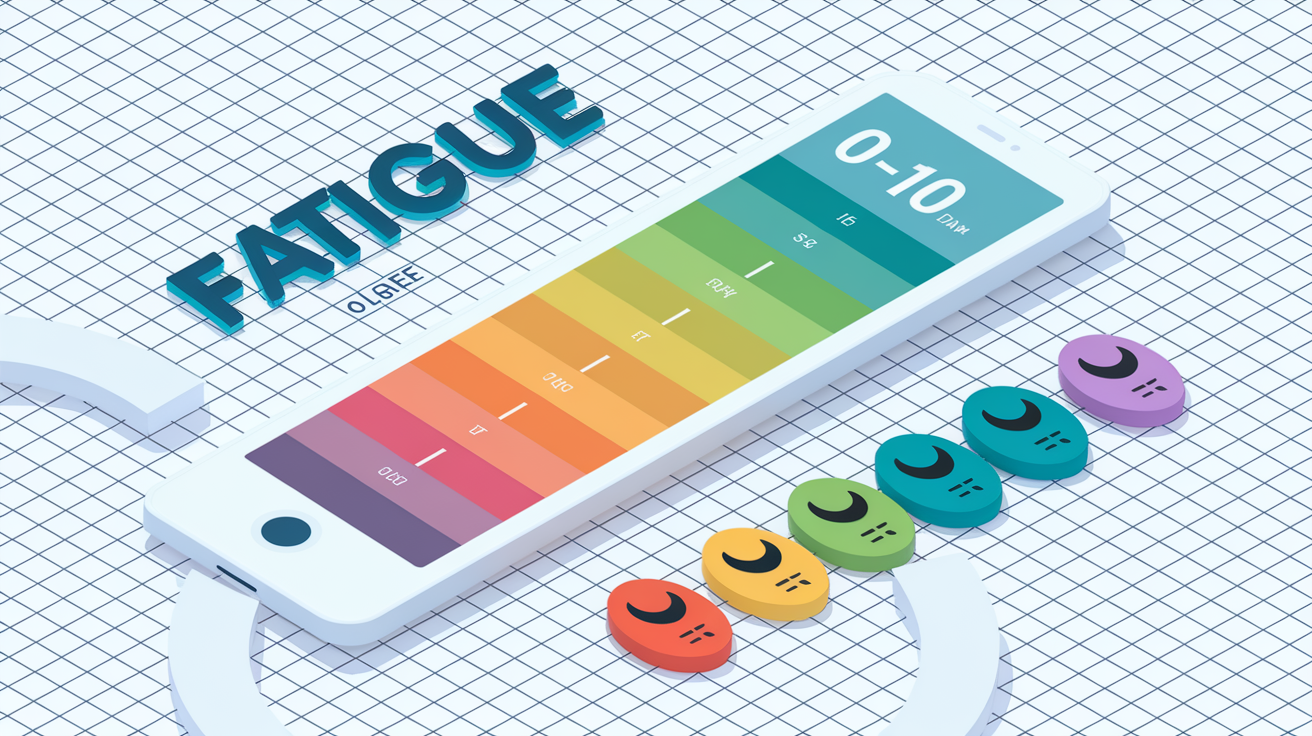
- Daily fatigue rating (0 to 10, where 0 is “I feel great” and 10 is “I can’t function”)
- How long the fatigue lasted (minutes or hours of low energy)
- Sleep hours plus a quality score (total time in bed and how rested you felt, also 0 to 10)
- Mood rating plus related symptoms (irritability, brain fog, anxiety, they often show up together)
- Diet, alcohol, and caffeine notes (what you ate, when you had your last coffee or glass of wine)
- Stressors plus physical activity (work deadlines, family demands, whether you moved your body)
How Perimenopause Hormones Influence Fatigue Patterns
Estrogen and progesterone don’t just drop during perimenopause. They spike and crash, sometimes within the same week. Estrogen receptors exist throughout your body (brain, muscles, gut, heart), so when levels swing, you feel it everywhere. One day you might wake up energized. The next, you’re wired at night but exhausted by 2 p.m.
Sleep disturbances hit about 85% of perimenopausal women. And they make everything worse. Night sweats wake you up. Insomnia keeps you staring at the ceiling. Poor sleep increases your blood sugar response to meals the next day, which triggers cravings for refined carbs and sets off another energy crash. Hot flashes affect about 45% of women (less common than you’d think), but sleep problems are nearly universal.
Perimenopause typically lasts 4 to 10 years, often starting in your 40s. Fatigue doesn’t stay constant during that time. It shifts day to day because your hormones shift day to day. That’s why tracking is so useful. You can’t rely on memory when your energy levels change this much.
What to Log in a Perimenopause Fatigue Symptom Tracker
Tracking fatigue means tracking the things that shape it. You’re not just writing down “tired.” You’re looking for the variables that make tired worse or better. The goal is collecting enough information that you can start to see which habits, foods, stressors, or sleep patterns show up on your hardest days.
A good tracker captures the basics (how tired you felt, when it started, how long it lasted) and then layers in context. That context is what reveals the pattern. Maybe your worst fatigue days follow nights when you had wine with dinner. Or maybe they line up with your cycle. Or with back-to-back stressful work meetings. Or with skipped meals.
Weekly summaries help, too. At the end of each week, note your average fatigue score, your average sleep hours, and the top three things that seemed to make fatigue worse. That weekly snapshot makes it easier to spot trends over time without getting lost in daily details.
| Field to Track | Why It Matters |
|---|---|
| Date and time of fatigue onset | Helps you see if fatigue clusters at certain times of day or week |
| Fatigue intensity (0 to 10 scale) | Gives a clear, comparable number you can track over weeks |
| Duration (minutes or hours) | Shows whether fatigue is fleeting or lasts most of the day |
| Sleep quantity and quality | Poor sleep is one of the strongest predictors of next-day fatigue |
| Diet, alcohol, caffeine timing | Reveals food-related energy crashes or sleep disruption from late drinks |
| Stress level and exercise | High stress and inactivity both worsen fatigue, tracking shows the link |
Sample Layouts for a Perimenopause Fatigue Symptom Tracker
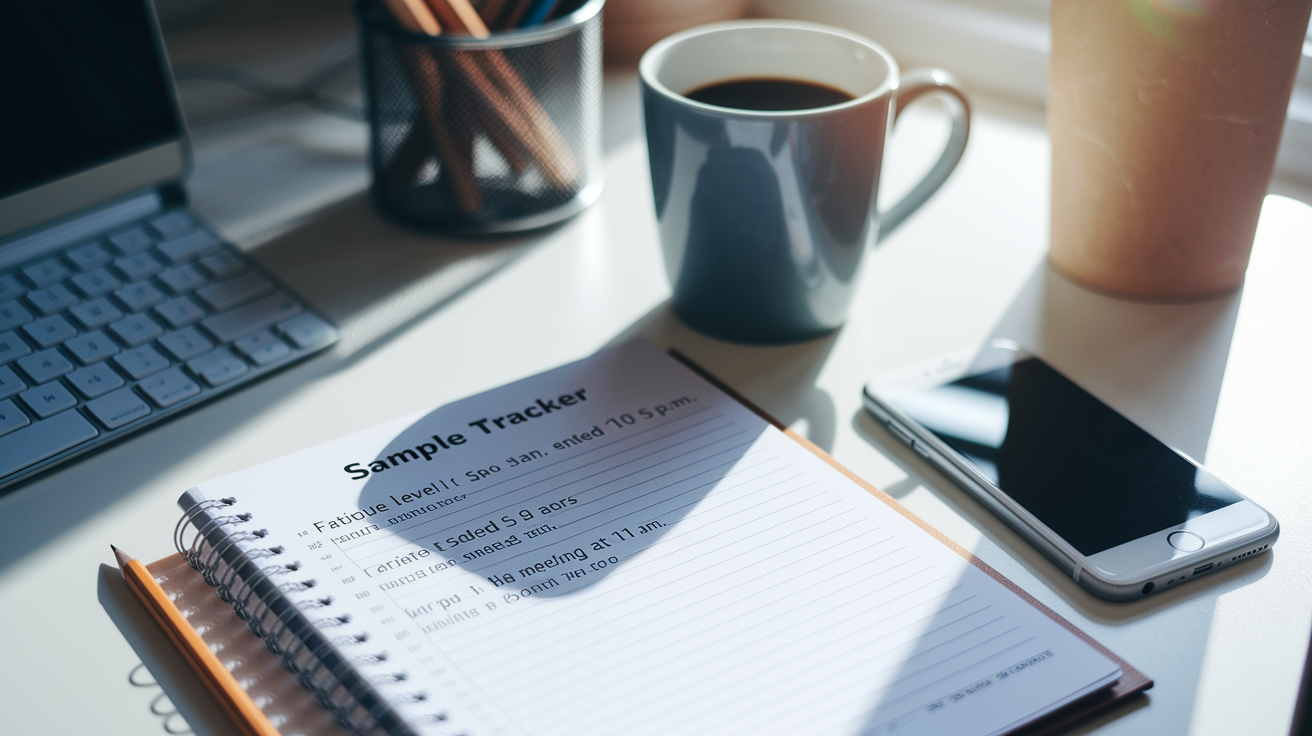
A filled sample entry shows you what “specific” really means. Instead of writing “felt tired all day,” you’d write something like this: “Fatigue level 7/10, started 10 a.m., lasted until 5 p.m. Slept 5 hours last night, woke up three times with night sweats. Had coffee at 9 a.m. and again at 3 p.m. Skipped breakfast. Big work presentation at 11 a.m., felt wired but exhausted at the same time.”
That level of detail lets you look back and see the compounding factors. Short sleep, caffeine on an empty stomach, high stress, no food until lunch. It’s not one thing. It’s the stack.
Your daily log can be simple. One row per day, with columns for the fatigue score, sleep score, what you ate, any symptoms that showed up (brain fog, irritability, headache), and a notes column for context. Weekly summaries pull out the averages and flag anything that repeated. Monthly correlation charts (if you’re using a spreadsheet or app) can show you visually when fatigue spiked and what else was happening at the same time. Here are the key components of a useful daily entry:
- Fatigue rating (0 to 10 numeric scale, where 0 is no fatigue and 10 is debilitating)
- Time of day fatigue was worst (morning, afternoon, evening, night)
- Sleep data from the night before (total hours, number of wake-ups, quality rating)
- Mood and cognitive symptoms (anxious, irritable, brain fog, trouble concentrating)
- Food, drink, and caffeine log (what you ate, when you had alcohol or coffee)
Digital Options for Tracking Perimenopause Fatigue
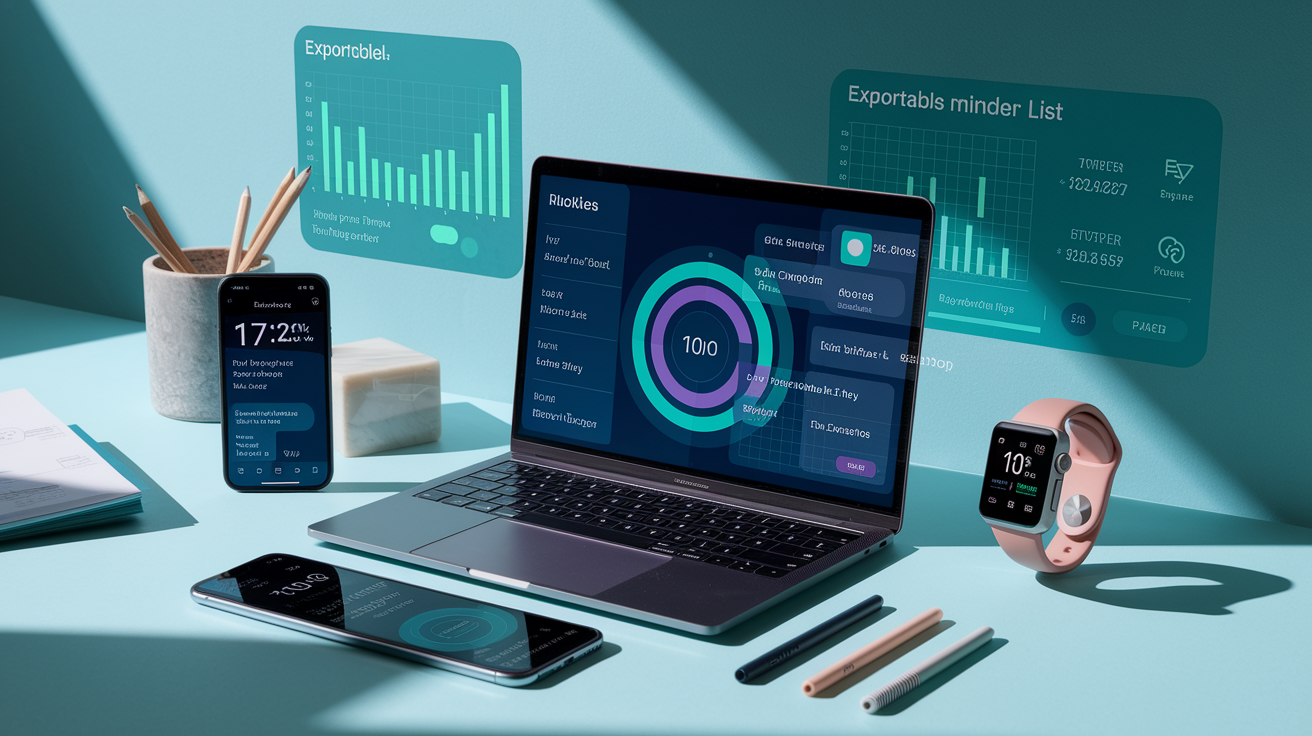
Apps make tracking easier because they send reminders, organize your data into charts, and let you export reports for your doctor. Many perimenopause apps include built-in checklists for common symptoms, fields for medications and supplements, and visual graphs that show trends over weeks. That’s helpful when you’re trying to explain patterns to a doctor who has 15 minutes to review your case.
Wearables add another layer. Devices like the Oura Ring track your sleep stages, resting heart rate, and activity levels automatically. Some users can access shareable Perimenopause Reports that summarize sleep quality, heart rate variability, and body temperature trends, all of which can inform treatment decisions. You still need to log fatigue intensity and context manually, but the wearable fills in the sleep and physiological data for you.
Digital tools also help you retain information. Research shows that up to 80% of medical information from appointments is forgotten immediately, and about half of what you do remember may be inaccurate. A tracker with timestamped entries and exportable summaries counters that. You’re not relying on memory. You’re looking at data.
| Tool Type | Key Features |
|---|---|
| Symptom-tracking apps | Daily reminders, symptom checklists, medication logs, exportable PDF reports |
| Wearable devices (e.g., Oura Ring) | Automatic sleep and activity tracking, heart rate variability, shareable reports |
| Spreadsheet templates (Google Sheets, Excel) | Customizable fields, automatic charts, weekly and monthly summaries |
| Printable PDF worksheets | Simple daily logs, no tech required, easy to bring to appointments |
Interpreting Fatigue Patterns in Perimenopause
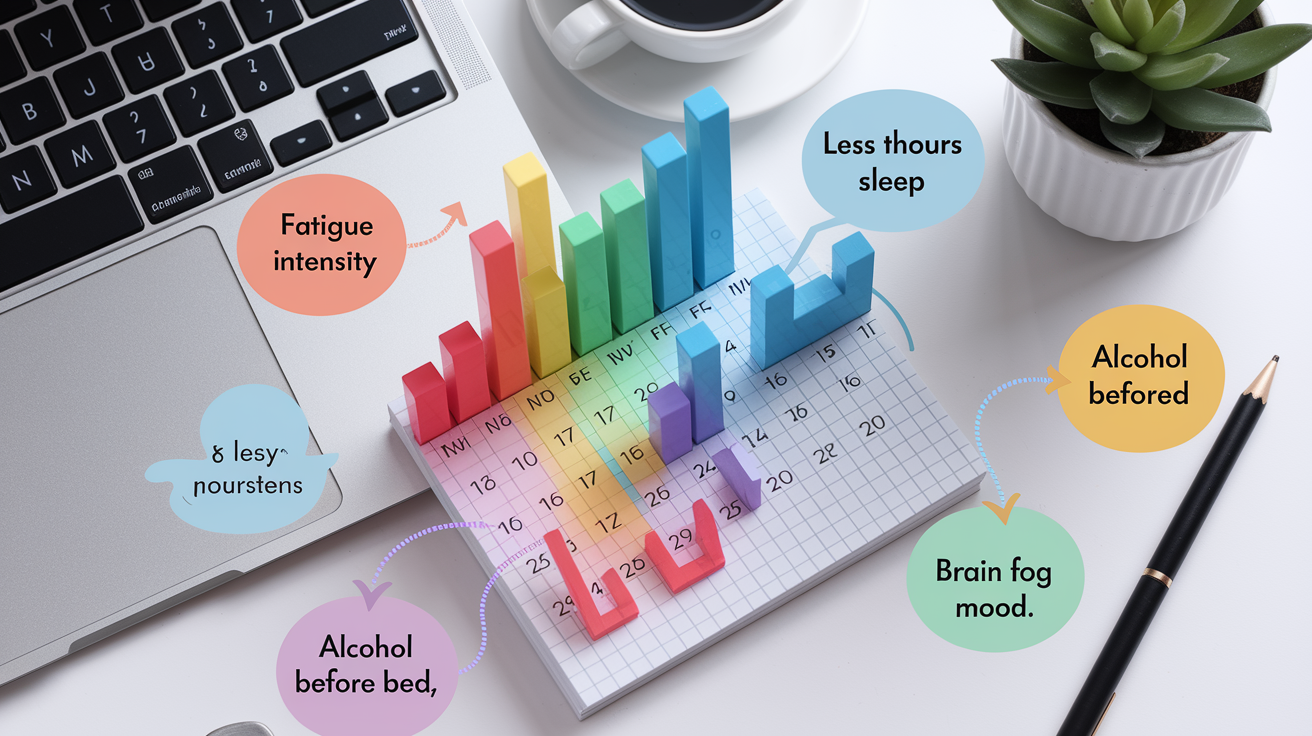
Patterns reveal themselves when you review your tracker over weeks, not days. Look for fatigue spikes that line up with specific behaviors or circumstances. If your worst fatigue scores cluster on days after you slept fewer than six hours, that’s a pattern. If they show up the morning after you had alcohol within four hours of bedtime, that’s another. If fatigue is consistently higher during the second half of your menstrual cycle, that’s hormonal.
Symptom clusters matter, too. Fatigue often doesn’t show up alone. It arrives with brain fog, irritability, and poor sleep. When you track all of those together, you start to see that they move as a group. A day with a fatigue score of 8 might also have a mood score of 7, a sleep quality score of 3, and notes about forgetting words in a meeting. That cluster suggests your nervous system and metabolism are both under strain.
Track percent change in your average fatigue score over 2 to 8 weeks, especially if you’ve started a new treatment, changed your diet, or adjusted your sleep routine. A drop from an average score of 7 to 5 is meaningful. It tells you the intervention is working. An increase tells you something isn’t helping, and you need to try a different approach. Here’s how to identify meaningful patterns in your data:
- Look for repeated links between fatigue and specific triggers (alcohol, poor sleep, skipped meals, high stress days)
- Track whether fatigue improves or worsens after you start a treatment (hormone therapy, supplements, dietary changes)
- Note symptom clusters (fatigue plus mood changes plus cognitive symptoms often move together)
- Calculate percent change in your average fatigue score over a set period (e.g., two weeks before and after an intervention)
Using Your Perimenopause Fatigue Tracker in Medical Appointments

Lab tests for perimenopause are unreliable because hormones fluctuate daily. Your doctor can’t diagnose based on a single blood draw. That’s where your symptom log becomes the roadmap. Bring a 2 to 12 week summary that shows your average fatigue scores, any patterns you noticed, and what you’ve tried so far.
Print or export a report that includes your symptom frequency, severity trends, suspected triggers, and the dates you started or changed any medications or supplements. If you’re already on hormone replacement therapy, your tracker helps your doctor see whether the dose is working or needs adjustment. If your fatigue is mild and sporadic, lifestyle changes (better sleep hygiene, a Mediterranean-style diet, consistent routines) might be enough. If it’s severe and persistent, that signals a need for medical treatment.
What to bring to your appointment:
- A summary showing your average fatigue score and sleep quality over the past 2 to 12 weeks
- Notes on patterns (e.g., “fatigue spikes the day after I drink wine” or “worst days are mid-cycle”)
- A list of any treatments you’ve tried, with dates and whether symptoms improved or worsened
Lifestyle Factors to Track That Influence Perimenopause Fatigue

Sleep quality drives fatigue more than almost anything else. If you’re waking up multiple times a night (whether from night sweats, anxiety, or just restless sleep), you’ll feel it the next day. Sleep disturbances affect about 85% of perimenopausal women. And poor sleep doesn’t just make you tired. It increases your blood sugar response to meals, triggers cravings for refined carbs, and makes it harder to manage stress.
Alcohol is a common culprit. Drinking within four hours of bedtime significantly disrupts sleep quality, even if you feel like it helps you fall asleep. Caffeine timing matters, too. A late afternoon coffee can keep you wired at night, which sets up another cycle of poor sleep and next-day fatigue. Getting outdoor light exposure immediately when you wake up helps regulate your circadian rhythm and improves sleep quality that night.
Diet plays a bigger role than most people realize. Following a Mediterranean-style diet (olive oil, vegetables, fish, whole grains, plant-based foods) showed a 35% reduction in menopause symptoms, including fatigue, in women who followed a personalized nutrition program for 18 weeks. You can read more about Mediterranean diet benefits for menopause. Consistency matters more than perfection. Eating poorly one day can cause noticeable effects the next. Here are the lifestyle factors worth logging every day:
- Sleep hours, wake-ups, and a quality score (0 to 10 for how rested you feel)
- Alcohol intake and timing (especially note if you drank within 4 hours of bed)
- Caffeine consumption and timing (morning coffee is fine, 3 p.m. coffee may disrupt sleep)
- Physical activity (type, duration, intensity, even a 15-minute walk counts)
- Stress load (work deadlines, family demands, anything that felt overwhelming)
Cognitive and Emotional Symptoms to Add to a Fatigue Tracker
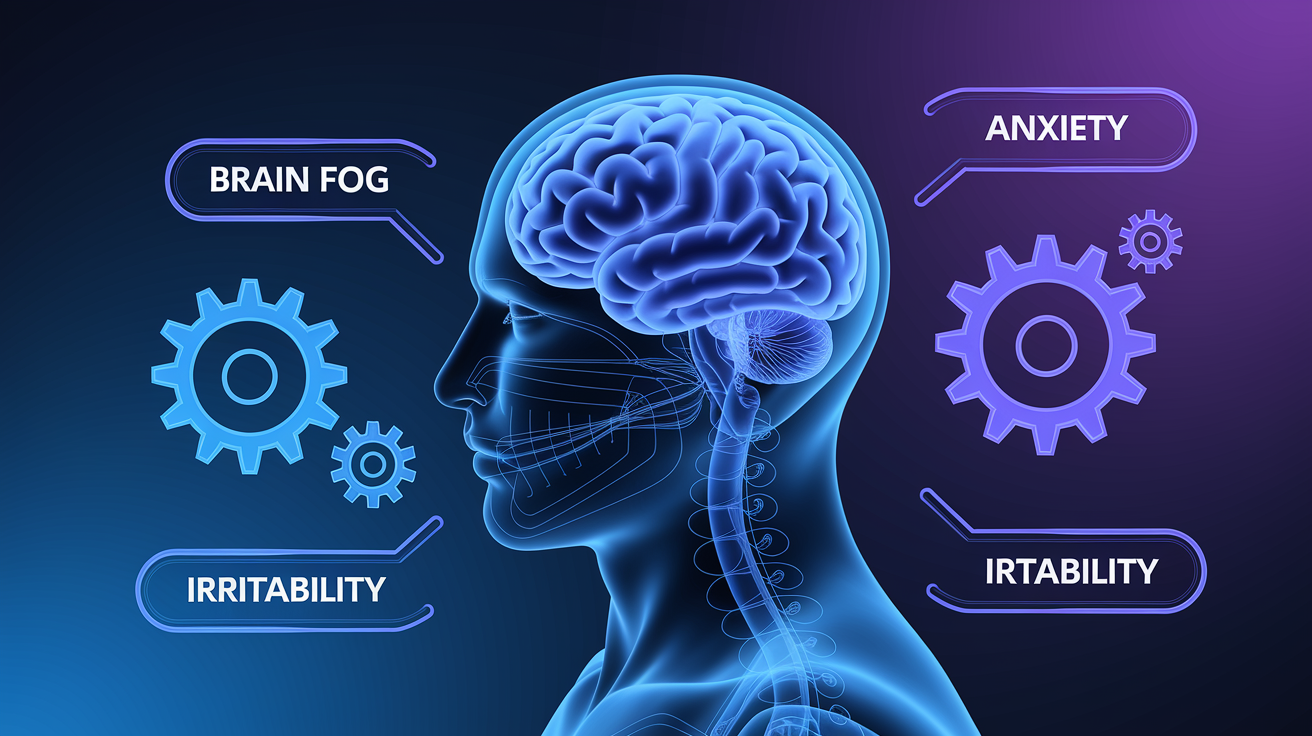
Brain fog, irritability, anxiety, and depression cluster with fatigue during perimenopause. These psychological symptoms have strong links to changes in the gut microbiome, and they often move together. A day when your fatigue is high might also be a day when you can’t find the right words, feel snappy with your family, or notice low-level dread for no clear reason.
Tracking these symptoms alongside fatigue helps you see the full picture. Fatigue isn’t just physical exhaustion. It’s often tied to cognitive load and emotional strain. When your tracker shows that brain fog, mood swings, and exhaustion all spiked on the same days, you and your doctor can address the root causes, whether that’s sleep disruption, hormone swings, inflammation, or a combination.
Add these cognitive and emotional symptoms to your daily log:
- Brain fog or memory problems (trouble concentrating, forgetting words, missing details)
- Mood swings (irritability, sudden anger, sadness, feeling overwhelmed)
- Anxiety or depression (persistent worry, low mood, lack of motivation)
Final Words
in the action, you found ready-to-use PDFs, spreadsheet templates, and app options plus simple layouts so you can start tracking today.
You learned what to log (fatigue score, sleep, mood, food, stress), why hormone swings matter, and how to spot patterns and share clear summaries with your clinician. Digital tools and wearables make charts and exportable reports easy.
Try a perimenopause fatigue symptom tracker for 2–4 weeks. Small steps and clear notes often reveal what helps — and that’s hopeful.
FAQ
Q: What is a perimenopause fatigue symptom tracker?
A: A perimenopause fatigue symptom tracker is a simple tool that logs daily tiredness, sleep, mood, and triggers so you can spot patterns and bring clear summaries to your clinician.
Q: What ready-to-use tools are available for tracking?
A: Ready-to-use tools include downloadable PDFs, spreadsheet templates, and apps with charts, reminders, and exportable clinician reports—start with a PDF or spreadsheet, then try an app for ongoing tracking.
Q: What should I log in my tracker?
A: What to log includes date/time, fatigue intensity (0–10), duration, sleep hours and quality, mood, food/alcohol/caffeine timing, stress, activity, medications, and related symptoms like brain fog.
Q: How do perimenopause hormones influence fatigue patterns?
A: Perimenopause hormone swings (estrogen and progesterone) cause day-to-day changes in energy, sleep quality, body temperature, and mood, so fatigue often varies and links to night sweats or poor sleep.
Q: How should I rate fatigue severity?
A: Rate fatigue severity using a 0–10 numeric scale (0 no fatigue, 10 worst), which is quick, consistent, and makes it easier to compare days and spot meaningful trends.
Q: How can digital tools and wearables help with tracking?
A: Digital tools and wearables add sleep and activity data, automatic charts, reminders, and exportable reports, which improve accuracy and make clinic visits more productive.
Q: How do I interpret patterns in my tracker?
A: Interpret patterns by looking for repeated links—like <6 hours sleep, alcohol before bed, or cycle phases—and track percent change in average fatigue scores over 2–8 weeks to measure progress.
Q: How should I use the tracker during medical appointments?
A: Use the tracker to present 2–12 week summaries showing average scores, top triggers, and treatment response; bring printouts or exported reports to guide the discussion.
Q: Which lifestyle and cognitive symptoms should I include?
A: Include lifestyle factors such as sleep, diet, light exposure, exercise, and alcohol timing, plus cognitive and mood symptoms like brain fog, irritability, and anxiety to find key triggers.
Q: How long until tracking helps reduce symptoms?
A: Tracking can help quickly; a trial found about a 42% symptom reduction after two weeks of consistent tracking, though clear trends and lasting changes usually need 2–8 weeks.